

AMAZON BUSINESS
Program
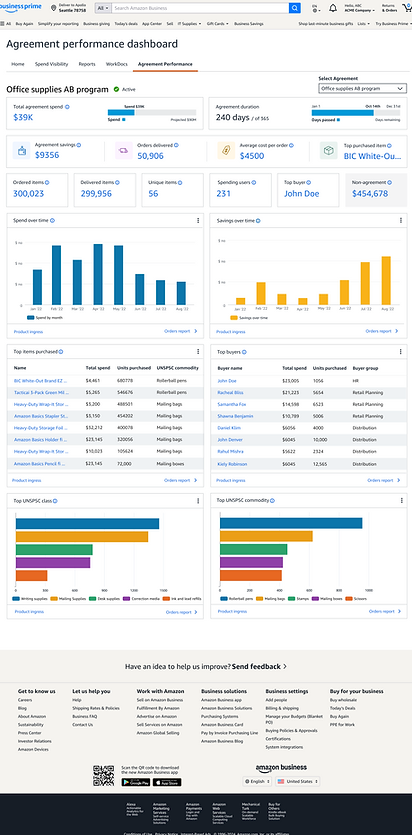
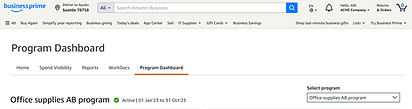
Dashboard
A one-stop shop for Business Prime members to review relevant metrics and visualizations about specific programs.
This new dashboard monitors key metrics and provides spend visualizations to optimize agreements across categories, including IT, using managed spend or curated catalogs. The experience is unique to each organization’s managed spend programs, allowing teams to track program details, spend analytics, and other KPIs with greater ease and automation.
Impact: Program Dashboard enabled $1.02B Group Managed Spend visibility in 2024, with $1.8B projected for 2025. This helped increase program renewals.
Press release here
My Role: Lead UX Designer
Team: Principal Product Manager, UX writer, 6 Backend Developers, 3 Frontend UI developers.
Partnership: AB Sales & Program team to incorporate their knowledge into this feature.
Leadership: Design Director, Product Director, Sales Leader AMER & EMEA, Tech Director
.png)


Amazon Business Vice President presenting the Program Dashboard at the Reshape conference during the Tech Innovation talks.
What is an Amazon Business Program?
Amazon Business programs are specialized procurement solutions, policies, and management tools that allow organizations to control spending, enforce compliance, and streamline purchasing processes across their organization.

Amazon Business Programs flow
Breaking down the steps into the common actions involved in the process, without categorization, communications, and other functions

Who are the users?
Procurement Administrator
Senior procurement professionals who configure and manage the entire procurement ecosystem. Responsible for setting organization-wide policies and programs.
Business Unit Managers
Mid-level managers responsible for procurement within specific departments. Need visibility into their department's spending and compliance. May have delegated authority to approve certain purchases.
Financial Controllers
Finance professionals who oversee organizational spending. Interested in cost savings metrics and spend optimization.
Need: Dashboard for reporting and monitoring their team's activities around programs.
Need: Effectiveness of Programs and renewals based on performance.
Need: Need high-level reporting and budget tracking capabilities for cost savings metrics and spend optimization.
Customer Problem
Painpoints
-
Limited visibility into organization-wide spending
-
Time-consuming manual reporting processes
-
Difficulty enforcing procurement policies consistently
-
Managing multiple systems for procurement
Thoughts/Feelings
-
"Our current process is too manual and time-consuming."
-
"I need better visibility into departmental spending."
-
"How can I make policy compliance easier to track?"
-
"Can I consolidate our procurement tools?"
Customer Journey
PLANNED SPEND

User Stories
DIVE DEEP
1. Agreement Performance Monitoring
-
As a procurement administrator, I want to see real-time agreement utilization metrics so that I can monitor if we're on track to meet our annual commitment.
-
As a procurement administrator, I want to view savings achieved through negotiated agreements so that I can demonstrate the ROI of our procurement initiatives.
-
As a procurement administrator, I want to see the days remaining in the agreement term, so that I can proactively plan for renewals or renegotiations.
-
As a procurement administrator, I want to compare actual spend against projected spend so that I can identify if an agreement is underperforming.
3. Track Order + Fulfillment Management
-
As a procurement administrator, I want to see order fulfillment rates by supplier so that I can identify vendors with delivery issues.
-
As a procurement administrator, I want to track average delivery times across orders so that I can ensure service level agreements are being met.
-
As a procurement administrator, I want to be alerted about delayed or unfulfilled orders, so that I can follow up with suppliers proactively.
-
As a procurement administrator, I want to see the volume of orders by day/week/month, so that I can identify purchasing patterns.
2. Spend Visibility & Compliance
-
As a procurement administrator, I want to see the ratio of agreement vs. non-agreement spend, so that I can identify compliance gaps.
-
As a procurement administrator, I want to identify top spenders outside of agreements, so that I can target them for training or intervention.
-
As a procurement administrator, I want to receive alerts when non-agreement spend exceeds defined thresholds, so that I can take immediate corrective action.
-
As a procurement administrator, I want to visualize spending patterns across departments, so that I can identify which areas need additional procurement support.
4. Purchasing Pattern Analysis
-
As a procurement administrator, I want to see monthly spending trends to identify seasonal patterns or anomalies.
-
As a procurement administrator, I want to compare current purchasing patterns with historical data to forecast future needs.
-
As a procurement administrator, I want to identify frequently purchased items across departments so that I can negotiate better volume discounts.
-
As a procurement administrator, I want to see which items are commonly purchased together, so that I can create optimized procurement bundles.
5. Product Category Management
-
As a procurement administrator, I want to see spending broken down by product category, so that I can develop category-specific strategies.
-
As a procurement administrator, I want to identify which product categories have the highest non-agreement spend, so that I can prioritize new agreements.
-
As a procurement administrator, I want to compare pricing across similar products in the same category, so that I can standardize on the most cost-effective options.
-
As a procurement administrator, I want to see which departments spend on which categories, so that I can target category-specific policies.
6. User Adoption & Training Targeting
-
As a procurement administrator, I want to see spending broken down by product category, so that I can develop category-specific strategies.
-
As a procurement administrator, I want to identify which product categories have the highest non-agreement spend, so that I can prioritize new agreements.
-
As a procurement administrator, I want to compare pricing across similar products in the same category, so that I can standardize on the most cost-effective options.
-
As a procurement administrator, I want to see spend on categories, so that I can target category-specific policies.
7. Budget & Cost Control
-
As a procurement administrator, I want to track spending against procurement budgets so that I can ensure we stay within allocated funds.
-
As a procurement administrator, I want to be alerted when spending approaches budget thresholds, so that I can take proactive action.
-
As a procurement administrator, I want to analyze the cost per order over time, so that I can identify efficiency trends.
-
As a procurement administrator, I want to see spending forecasts based on current rates, so that I can plan future budget needs.
8. Savings Opportunity Identification
-
As a procurement administrator, I want to see potential savings from converting non-agreement spend to agreement pricing, so that I can prioritize new contract negotiations.
-
As a procurement administrator, I want to identify products with high price variance so that I can standardize on lower-cost alternatives.
-
As a procurement administrator, I want to receive automated recommendations for consolidation opportunities so that I can optimize our procurement strategy.
Proposed use-cases
After a few syncs with our PM and Dev, we all aligned on the following use-cases to solve for V1 feature:
1. Understand agreement spend and savings progress towards procurement objectives
2. Quick snapshot of agreement performance

Figjam session with Sales Leaders
My Role: Initiator, Planner, Facilitator, and consolidation of insights.
2 hr workshop aimed at capturing key needs across all programs. I, along with my PM, conducted a Figjam session with 11 Sales leaders from all the different verticals to get their feedback on key metrics, data visualizations, and insights that are important to AB customers.


1:1 Customer Calls + Customer sessions
My Role: Co-Planner, Facilitator, and consolidation of insights.
Findings/ Top 4 customer asks derived from the conversations
-
Granular Program Expenditures: Customers are seeking the ability to isolate and analyze spend data specific to individual agreements and corporate programs.
-
Contractual ROI & Savings: There is a high demand for visibility into the tangible savings and cost-avoidance metrics generated by existing agreements.
-
Off-Contract Spend Tracking: A key priority is identifying and quantifying "non-agreement" spend to reduce leakage and improve contract compliance.
-
Unified Program Portfolio: Customers want a "single pane of glass" view that aggregates performance and spending data across all active programs and agreements.
Model for Program Adoption

Designs Tenets

Data-Forward, Action-Ready
Surface actionable insights prominently, not just raw data.
Scalable Efficiency
Design for both small and large-scale procurement operations.
Contextual Intelligence
Present information with meaningful context that helps users make informed decisions.
UX Explorations


Usability Testing


Dashboard Impact
USABILITY STUDY
Using AI we were able to quickly summarize the impact of this Dashboard after all the usability studies.
Gain holistic visibility across all procurement programs
Streamline program management through a unified interface
Enforce consistent policies across the organization
Track performance metrics for all procurement initiatives
Identify optimization opportunities across programs
Simplify reporting to stakeholders about procurement activities
Version 1 🚀
Data filled
Hover states

Data filled - Widgets can be toggled for different view options (example: Graph can turn to a table for better conprehension)

Error states

No Data available

Widgets with action
Handoff Details
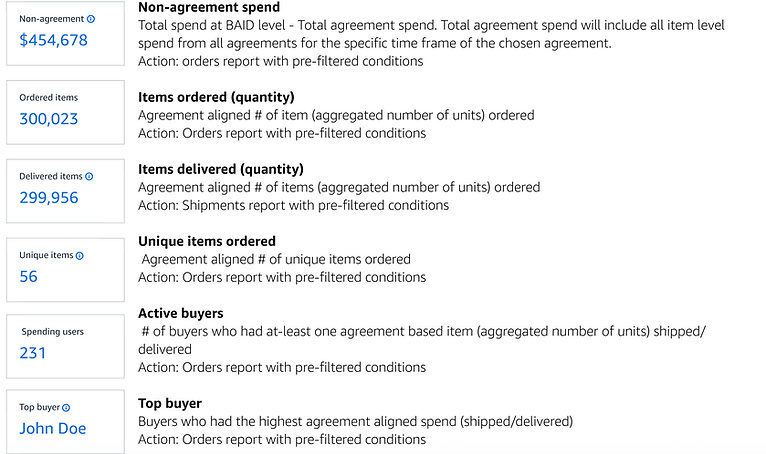
When providing details for implementation to the Development team, I provided the entire package - mocks, different states, prototype, and, in this case, what each widget is showing, so that the backend logic is captured and there is no confusion during implementation. Also, what kind of report is generated for each number on the widget was also provided.
See below an example of these details.
Success Metric
Program Dashboard enabled $1.02B Group Managed Spend visibility in 2024, with $1.8B projected for 2025. The effectiveness of the Program Dashboard for the first quarter for procurement administrators was measured by :
Focus Area
Before (The Friction)
After (The UX Solution)
The Result (Success Metric)
Time Savings
Manual data entry across multiple tabs, 15+ minutes per report.
Single-pane-of-glass view with automated data fetching.
65-75% reduction in admin time.
Approval Speed
Approvers overwhelmed by email chains and lack of context.
Contextual content visible at a glance through the dashboard.
Faster approval cycles and reduced bottlenecks.
Cost Control
Users accidentally buying from non-contracted, high-cost vendors.
Visual Nudging to highlight "Preferred" vendors in the UI.
8-12% reduction in non-compliant spending.
Strategy
Procurement seen as a "clerical" function.
Executive Insights Layer showing procurement’s ROI.
Enhanced strategic value
* Values based on the first quarter for procurement administrators
Feature Marketing Design
Feature Discoverability
Marketing page
banner design

Final Design


