

AMAZON BUSINESS
Revised Experience
An exclusive for Amazon Business Prime members, the revised Policy Adherence Dashboard provides comprehensive spend visibility and compliance monitoring for procurement professionals.
This revised dashboard monitors key metrics and provides spend visualizations to optimize spend by policies. The experience is unique to each organization’s policies, allowing teams to track policy performance details and analyze spend.
Impact: What once required a grueling 4-6 hours of manual data compilation has been streamlined into a 30-60 minute strategic review, empowering managers to move beyond fragmented data to identify cross-departmental patterns easily. This transformation is most evident in the reporting lifecycle; the previous burden of spending 3-4 days to create month-end reports, often with a limited ability to measure policy effectiveness, has been replaced by automatically generated reports paired with just 1-2 hours of high-level analysis. This shift not only saves hundreds of man-hours but also provides clear policy effectiveness metrics, allowing the organization to transition from reactive troubleshooting to data-driven strategic growth.
My Role: Lead UX Designer
Team: Principal Product Manager, UX writer, 6 Backend Developers, 2 Frontend UI developers.
Partnership: Senior Product Manager- Guided Buying
Leadership: Design Director, Product Director & Tech Director

Previous Experience

Policy Adherence
Dashboard
What is Guided Buying Policy?
Amazon Business Policies are procurement governance tools that enable organizations to control, manage, and optimize their purchasing activities on the Amazon Business platform. These policies provide a structured framework that helps organizations direct spending toward preferred suppliers, enforce compliance requirements, and achieve cost savings while maintaining appropriate controls over the procurement process.
Understanding Policy Configuration Tools
Amazon Business provides several tools for configuring procurement policies
Category-Based Rules
- Set policies based on product categories (UNSPSC codes)
- Apply different rules to different departments or user groups
Example: Office supplies = Preferred, Premium electronics = Restricted
Spending Thresholds
- Configure approval workflows based on purchase amount
- Set different thresholds for different departments or roles
Example: Purchases under $500 = automatic approval, Over $500 = manager review
Supplier Management
- Designate preferred supplier status
- Block specific suppliers that don't meet standards
Example: Contract suppliers = Most Preferred, Non-vetted suppliers = Restricted
Exception Handling
- Create approval workflows for restricted items
- Implement justification requirements for policy exceptions
Example: Department head approval required for restricted categories
Who are the primary users?
Procurement Operations Manager

Conducts current state assessment of policy compliance mechanisms. Identifies manual, inconsistent monitoring processes. Documents compliance gaps across departments and categories. Maps current reporting capabilities and limitations
Need: Fragmented data across multiple systems causes need for consistent policy interpretation across departments.
Procurement Administrator
Configures procurement systems. Manages user access and permissions. Processes policy exceptions. Runs routine compliance reports. Handles first-level policy questions from users
Need: Dashboard for reporting and monitoring their team's activities
Customer Painpoint
Frustrated by the lack of visibility and control
Overwhelmed by manual data compilation requirements
Limited insight into category-specific policy compliance
Anxious about gathering sufficient compliance documentation
Thoughts/Feelings
"I need a better centralized way to monitor our procurement practices and policy compliance."

Use-cases
Deriving use-cases
2 hr Figjam workshop with Sales leaders in the US and another session with EU
Orchestrated a high-impact, 2-hour strategic workshop designed to pinpoint critical needs across our entire program portfolio. This intensive session, which I spearheaded alongside my Product Manager, brought together 11 elite Sales leaders representing every vertical in our organization.
Our mission: To extract invaluable insights on key performance metrics, data visualization priorities, and business intelligence crucial for AB's customers. This collaborative deep-dive not only unified diverse perspectives but also laid the foundation for a customer-centric, data-driven approach tailored to each unique program type.
The workshop's outcomes are set to revolutionize how we deliver value, ensuring our solutions precisely align with the sophisticated demands of AB customers across all segments.
Derived use-cases
As a customer:
- I want to view MS deal adoption-Visualize Capture rate for procurement leads - covering items with custom deal prices and captured adjacent category spends.
- I want to track purchases against blocked/restricted categories in my organization.
- I want to view access to comprehensive sustainability and ESG metrics for our Amazon Business purchases.
- I want to view managed Spend tracking - check negotiated prices are applied.
- I want to track different department-specific spend and monitor how closely they are moving toward their allotted spend.
- I want to use charts/visuals from SV in my presentation material for my leadership.
- I want to see spending by user/group over an x time period for policies.
- I want to understand spending patterns across groups for policies.
- I want a visualization of spending across different categories for policies.
- I want to leverage data viz for internal business reviews. Easy to create nice visuals that matter for leadership review.
Figjam session with US Sales leader

Figjam session with EU Sales leader

Votes on existing KPIs by US Sales Leaders

Votes on existing KPIs by EU Sales Leaders

Model for Policy Dashboard
User level policy customization
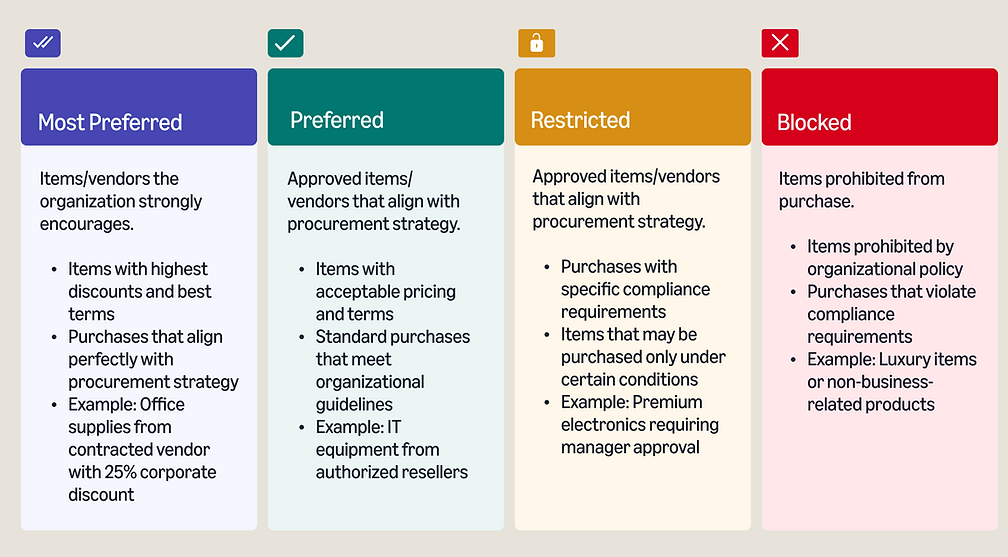
Policy
Governance
Framework
- Most Preferred
-PREFERRED
- RESTRICTED
Policy Dashboard
framework
PERSONALIZED DASHBOARD
Designs Tenets
Clarity Over Complexity
Present complex compliance data in simple, immediately understandable formats.
Actionable Insights, Not Just Data
Transform raw compliance data into actionable intelligence that drives decisions.
Contextual Awareness
Present information with sufficient context to make it meaningful and actionable.
Frictionless Exploration
Enable users to explore compliance data intuitively without technical barriers.
Meaningful Visualizations
Select visual representations that best communicate the specific type of compliance data.
Trustworthy Data Presentation
Build confidence in dashboard data through transparent, honest presentation.
Design Explorations

UX Proposed
Spend visibility homepage redesigned with prompt enablement for customers. Also improving the current access for dashboards.
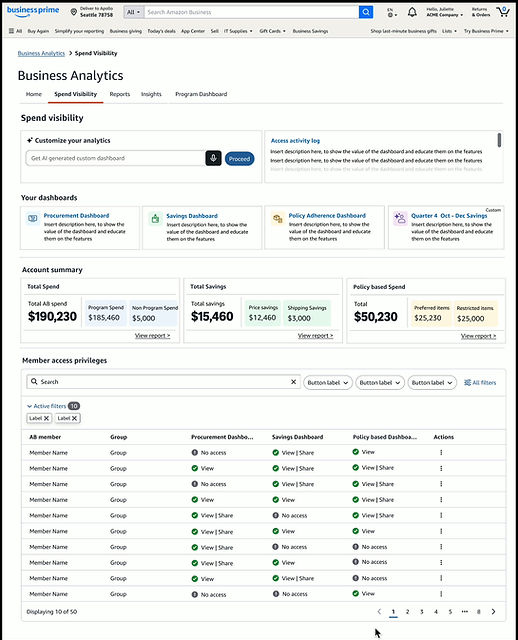
Revised experience


Previous experience

Proposed a dashboard that enables users to just not gather actionable data but also compare the performance.
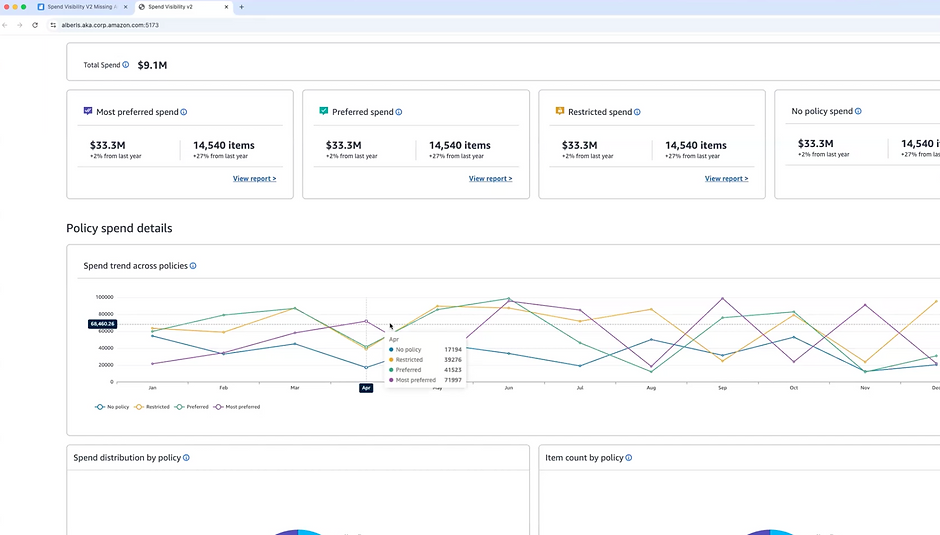
Revised experience
Used a AWS quicksight framework to show the different dashboards available.
Previous Experience
Proposed a dashboard that enables users to just not gather actionable data but also compare the performance.
Revised experience
UX Prototype for Usability Test
User Testing
Dashboard Impact
Strategic
Operational
Analytical
Resource Optimization
Process Improvement
Transformed the user mental model from crisis-response to strategic foresight by designing a predictive notification system that identifies compliance risks before they escalate.
UX Impact Replaced cognitive overload and 'firefighting' with a sense of control and long-term planning
Eliminated operational friction by reducing complex policy workflows into a centralized, intuitive interface, cutting administrative overhead and manual intervention.
UX Impact Simplified a fragmented experience into a single, cohesive source of truth, drastically reducing the "time-to-task."
Empowered users to move beyond data consumption to insight-driven action through the design of contextual, high-signal data visualizations.
UX Impact Reduced the "data-to-decision" gap, ensuring users spend less time interpreting charts and more time executing informed strategies.
Optimized human capital by designing intelligence-backed prioritization tools, ensuring users focus their limited time on high-impact procurement efforts.
UX Impact Targeted the user's attention toward 80/20 high-value activities, effectively 'multiplying' team capacity without increasing headcount.
Established a virtuous feedback loop within the UI, enabling users to iteratively refine and optimize compliance policies based on real-world performance data.
UX Impact Moved the product from a static tool to a dynamic ecosystem that grows smarter with every user interaction.
Designs delivered + launched


Review with Dev Team
Checking specs in mobile responsive as well to ensure experience works across different screen specs


Ensuring development aligns with the design mocks and testing the different hover functionalities and what content they represent. Providing timely feedback is key in getting the launch experience on time with high quality.
Success Metric
EFFICIENCY Reduction in manual monitoring time by around 60% and 35% better resource allocation.
COMPLIANCE Increase in policy adherence by 35% and an 8–12% drop in non-compliant spending.
ADOPTION Higher user satisfaction and more frequent dashboard usage with fewer support requests.
STRATEGIC Faster identification of issues and improved ability to prove procurement’s value to the organization.
Using prompts in AI, I created a UX Success Scorecard to track these metrics quarterly. It aligns UX design performance directly with the business goals we had identified.
UX Success Scorecard
UX METRIC
DEFINITION
DATA SOURCE
TARGET GOAL
Time-to-Insight
Time taken for a user to find a specific compliance violation.
User Testing / Analytics
< 3 Minutes
Task Success Rate
% of users who successfully resolve an
issue after seeing an alert.
Event Tracking
> 90% Success
Feature Adoption
% of the procurement team using the dashboard weekly.
Login Logs
100% Team Coverage
System Usability (SUS)
A 10-item questionnaire to measure perceived ease of use.
User Survey
Score > 80 (Grade A)
Support Friction
Number of "How-to" tickets vs. total dashboard users.
Help Desk / Amazon SIM
< 5% of User Base
Overall Dashboard Impact
The revised Policy Adherence dashboard transformed the working of Procurement Operations Managers in the following ways through the various phases:
Morning Routine
Monthly activities
Weekly activities
Quarterly activities
Before Dashboard
-
Check email for policy exception requests & violations
-
Manually follow up on outstanding compliance issues
-
Prepare for meetings with limited data
Before Dashboard
-
Spend 4-6 hours manually compiling compliance data
-
Limited ability to spot patterns across departments
-
Reactive responses to compliance issues
Before Dashboard
-
Spend 3-4 days creating month-end reports
-
Limited ability to measure policy effectiveness
-
Difficult to justify policy adjustments to stakeholders
Before Dashboard
-
Policy adjustments based on limited data
-
Difficulty prioritizing focus areas
-
Challenges in demonstrating procurement's value
With Dashboard
-
Review dashboard alerts for new compliance trends
-
Prioritize interventions based on dashboard insights
-
Prepare for meetings with real-time data and visualizations
With Dashboard
-
Spend 30-60 minutes reviewing dashboard insights
-
Easily identify cross-departmental patterns
-
Proactively address emerging compliance trends
With Dashboard
-
Generate reports automatically with 1-2 hours of analysis
-
Clear measurement of policy effectiveness metrics
-
Data-backed recommendations for policy adjustments
With Dashboard
-
Data-driven policy refinement
-
Clear prioritization based on compliance metrics
-
Quantifiable demonstration of procurement's value
